From: The World In Your Head by Steven Lehar

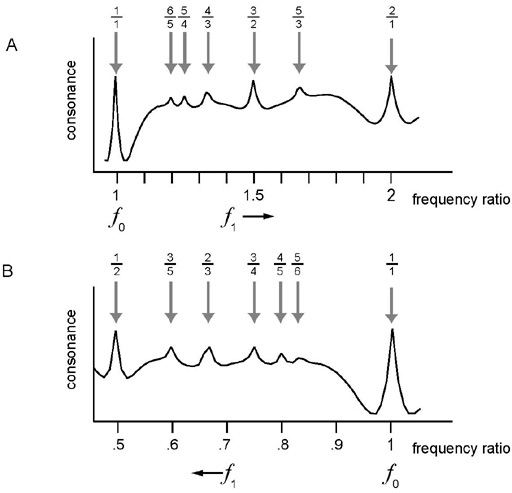
Fig. 11.4 Plots of consonance between two notes as a reference tone f0 is held fixed at one frequency (normalized here to frequency f0 = 1) while a test tone f1 is varied (A) from that frequency to the octave above (frequency f1 =2), and (B) from that same frequency (frequency 1) down to the octave below (frequency f1 = 0.5). The peaks in these plots mark the points of consonance, which define a structured pattern at integer ratios between the frequencies of the reference and test tones.