
See also Part I of this paper: Computational Implications of Gestalt Theory I
In the first paper of this series a perceptual modeling approach was proposed to model the properties of illusory figures as a transformation from the information present in the stimulus to the information apparent in the subjective percept. This approach suggested a Multi-Level Reciprocal Feedback model of perceptual processing. That model is now compared with corresponding neural network models to show how the same concept can be elaborated to account for a number of second order properties of collinear illusory contour formation. The perceptual modeling approach liberates the model from neurophysiological considerations which have handicapped the neural network theories, which allows the model to more accurately reflect the Gestalt properties of emergence, reification, and amodal perception apparent in the illusory phenomena. The perceptual model also clearly defines exactly what the output of the model represents in perceptual terms, allowing the output of the model to be compared directly with psychophysical data and with the subjective experience of these illusions.
This paper is the second in a two part series, which together outline the computational implications of Gestalt theory. In the first part (Lehar 1999 a) a Multi-Level Reciprocal Feedback model (MLRF) was presented to account for the phenomenon of reification in perception, i.e. a filling-in of a more explicit visual representation based on a more abstracted visual input, as observed in visual illusions such as the Kanizsa figure. A general principle of reciprocal action was identified as an essential property of feedback processing, to account for the principle of emergence in perception as identified by Gestalt theory. These concepts were demonstrated with computer simulations of the Kanizsa figure that replicated the essential properties observed in this illusory percept in an isomorphic model of both the modal surface brightness component, as well as the amodal perceptual grouping component. The principles behind the formation of illusory contours by collinearity were presented in rudimentary form to account for the simpler aspects of those illusory phenomena.
In the present paper those concepts will be elaborated to account for more subtle secondary properties of illusory contour formation, as measured in psychophysical studies. The concepts expressed in present model were developed from an earlier model of collinear illusory contour formation, the Boundary Contour System / Feature Contour System (BCS/FCS) (Grossberg & Mingolla 1985, Grossberg & Todorovicz 1988) that introduced several innovative concepts in visual modeling. The properties of that model will be summarized, with emphasis on how that model expresses the essential Gestalt principles of emergence and feedback in perception. I will then show how the limitations of that model can be addressed by further application of those same Gestalt principles at a finer scale in the Directed Diffusion model, by replacing hard-wired template-like components in the BCS/ FCS model with more dynamic field-like mechanisms inspired by Gestalt theory. In particular, it will be shown that the mechanism of illusory contour formation can be described as a directed diffusion of the oriented edge signal in a direction parallel to detected edges, in a manner that relates to the non-directed diffusion of brightness signal observed in the phenomenon of surface brightness filling-in.
This section presents a review of some of the properties of illusory contours that have been quantified in psychophysical studies, with a focus on the specific subjective features generated by these phenomena. The computational models presented later in this paper will be tuned to account for the illusory properties described below.
Shipley & Kellman (1992) showed, using a stimulus similar to the Kanizsa figure, that the strongest contour is obtained at small separation, with a progressive decline in salience with increased separation. Banton & Levi (1992) showed that the strength of the illusory contour is a function of the contrast of the inducer relative to the background, and of the size of the inducer relative to the length of the illusory contour. These properties of the illusory contour will be referred to as first order properties, since these parametric manipulations preserve the most essential aspect of the phenomenon, i.e. a strict collinearity of the inducing elements producing a collinear percept.
The Kanizsa illusion exhibits a certain tolerance to deviation from strict collinearity of its inducers. These phenomena will be referred to as second order properties of the contour formation process. Kellman & Shipley studied the salience of the illusory contour as a function of various types of misalignments. They showed, for example, that the salience of the contour decreases progressively as a function of a bending mis-alignment of the inducers, as shown in Figure 1 a, corresponding to the curved Kanizsa triangle of Figure 1 b, and the illusion disappears altogether as the angle between the linear extensions of the inducing edges approaches 90 degrees. They also tested the effect of a shearing mis-alignment of the inducers, as shown in Figure 1 c, corresponding to the sheared Kanizsa triangle of Figure 1 d. This was found to produce a dramatic drop in contour salience even for small amounts of shear. Based on these findings, Kellman & Shipley (1991) define a set of relatability criteria that their experiments indicate must be met for illusory completion to occur. These include the maximum limit of 90 degrees for the bending mis-alignment, but very little tolerance for a shearing mis-alignment. The nature of the contour formation process however resists characterization in terms of hard Boolean limits as proposed by Kellman and Shipley (1991), because the contour is not observed to disappear abruptly at these limits, but rather, it exhibits an analog decline in salience as a function of both bending and shearing misalignments, and also as a function of size, contrast, and spatial separation. In fact this phenomenon is a prime example of a Gestalt field-like process that resists reduction to its local elements because, for example, the strength of the illusory contour has also been shown to be influenced by the symmetry, prägnanz and closure of the figure as a whole (Kanizsa 1979), factors that go beyond the geometrical relations between any pair of its elements. There is a need for a better quantitative characterization of these phenomena that captures these essential Gestalt properties of the illusion.

Taken together, the phenomena of illusory contours are very revealing of the specific interactions performed by the visual system, even if the functional rationale behind those interactions remains obscure. The first order properties are addressed even with a simple model of completion by cooperative filtering, as proposed in the MLRF model (Lehar 1999 a), although with certain significant limitations. The present paper will address these limitations, and propose modifications that will better address the first order properties, and discuss further modifications necessary to address the second order properties of collinear illusory contour formation.
The concept of perceptual modeling presented here is a development from an earlier model (Grossberg & Mingolla 1985, Grossberg & Todorovic 1988) known as the Boundary Contour System / Feature Contour System (BCS/FCS). The present model shares with that earlier model the goal of providing a computational mechanism whose dynamic properties reflect the observed properties of illusory contours. Grossberg's model is summarized schematically in Figure 2, using as an example an input of the Kanizsa figure, shown in Figure 2 a. The first stage of processing computes a spatial derivative, calculated by convolution with on-center off-surround and off-center on-surround (center-surround) receptive fields, shown schematically in Figure 2 b, producing a polar boundary representation shown schematically in Figure 2 c, where the white shading represents the response of on-center cells, the dark shading represents the response of off-center cells, while the neutral gray tone represents zero response from either cell type. In Figure 2 c the output of this processing is represented for simplicity in a single image, although in Grossberg's model this information is actually encoded in two separate images representing the distinct on-cell and off-cell responses. This image corresponds approximately to the polar boundary image in the MLRF model (Lehar 1999 a). The processing then splits into two parallel streams. The BCS stream proceeds as in the apolar processing in the MLRF model, with oriented filtering using a bank of orientation tuned filters, suggested schematically in Figure 2 d, producing an apolar oriented edge representation shown in Figure 2 e, followed by cooperative filtering with a bank of oriented cooperative filters, shown schematically in Figure 2 f, producing the apolar cooperative edge representation shown in Figure 2 g in which the illusory contours of the Kanizsa figure appear. The BCS incorporates a feedback loop between the oriented edge and the cooperative edge levels, so that the illusory contours generated in the cooperative layer propagate back to the oriented edge layer, although unlike the MLRF model, this feedback processing is communicated directly, rather than by reverse convolution through the cooperative filter. The FCS processing stream begins initially as a copy of the polar boundary image of the previous stage, but a spatial diffusion operation allows the darkness and brightness signals to spread spatially in all directions, with the constraint that the diffusion is restricted by edges in the BCS image, as explained for the MLRF model (Lehar 1999 a).
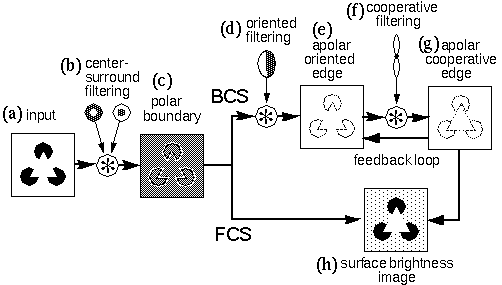
The BCS/FCS model introduced several innovative concepts in visual modeling. One of the major contributions of the model involves the use of feedback explicitly to account for emergence in perception, as seen in the emergence of the apolar illusory contour by feedback in the BCS module, and also in the brightness diffusion mechanism of the FCS module. The BCS/FCS also introduced the concept of modeling the modal and amodal components of the percept in explicitly distinct layers, the FCS representing the modal surface brightness percept, while the BCS represents the amodal grouping percept. These concepts of visual processing have been adopted in the MLRF model (Lehar 1999 a) and will be developed further here.
There are several significant differences between the present approach and Grossberg's model. In the first place, Grossberg's model is advanced explicitly as a neural network model, and indeed Grossberg claims to have identified specific cortical and subcortical regions corresponding to the layers in his model. However this hybrid approach of modeling visual processing simultaneously in neurophysiological and perceptual terms leads to certain problems. In the first place, the neural network approach is based on the assumption that current concepts of neurocomputation have captured the essential principles and processes active in visual processing, and that therefore those principles can be used to constrain the types of computation that can be considered to be neurophysiologically plausible. Furthermore, even within the conventional neural network paradigm, the description of the algorithm of perceptual processing is unnecessarily complicated by considerations of "neural plausibility", as that term is understood given the current state of knowledge in that field.
For example, it has been suggested that neurons encode analog values by frequency of action potentials. Since a spiking frequency cannot encode negative values, representations such as the polar boundary response of the retina must be modeled in separate on-cell and off-cell layers, as suggested by neurophysiological recordings from the retina. In the BCS model, retinal processing is simulated by two separate image convolutions, one using an on-center, and the other an off-center filter, and then each response is passed through a threshold to eliminate negative values. However the computational transformation apparently performed in this stage of processing can be expressed more parsimoniously as a single convolution with an on-center filter producing a single image with both positive and negative values, as suggested schematically in Figure 2 c and demonstrated computationally in Figure 3 c. Furthermore, the entire retinal processing stage of center-surround filtering contributes nothing to the model as a perceptual transformation, and is included in the BCS only on neurophysiological grounds.
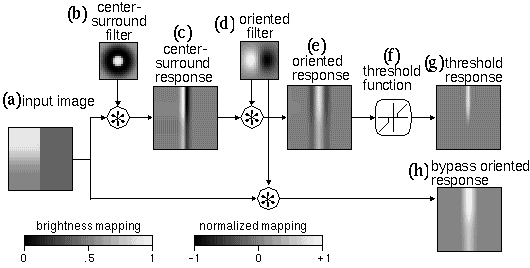
Even worse, this stage of processing introduces artifacts in the data stream that require still further complication in the model in the form of remedial processing intended to eliminate those artifacts. This problem is illustrated with computer simulations in Figure 3. An example input is shown in Figure 3 a, that represents a vertical brightness edge with greater contrast in the upper half of the image than the lower half. Figure 3 b, shows the center-surround filter used to produce the center-surround response, shown in Figure 3 c, by convolution with the input image. In Figures 3 b to h, a normalized mapping is used for display, i.e. positive values are depicted in lighter shades, and negative values are depicted in darker shades, while zero values are represented with a neutral gray tone. The center-surround response exhibits a positive ridge along the bright side of the edge, and a symmetrically opposed negative trough along the dark side of the edge, and the magnitude of these peaks is modulated by the contrast across the edge. Figure 3 d shows a vertical oriented filter that is convolved with the center-surround response to produce the vertical oriented edge response shown in Figure 3 e, to represent the oriented filtering of the center-surround image as proposed in the BCS model. This image exhibits a triple response to the original edge input, with a strong central positive ridge and weaker negative troughs on either side. The central peak is in response to the large contrast step between the positive and negative ridges of the center-surround image, while the weaker responses on either side of it are in response to the transition from the flat zero background to the positive and negative ridges in the center-surround image. In other words the ridges in the center-surround image introduce new spurious edges on either side of the original vertical edge. The problem with this triple response is that the negative side-lobes in this image are indistinguishable representationally from responses produced by actual dark / light vertical edges in the input, and therefore these features are spurious. Now the spurious negative peaks in Figure 3 e cannot be eliminated by a simple threshold to eliminate negative values, for if the contrast in the original edge were reversed, i.e. with a dark/light edge instead of a light/dark edge, then the center-surround and oriented responses would be flipped in polarity, the oriented edge now exhibiting a strong negative trough flanked by weaker positive ridges. Grossberg's solution is to apply a positive/ negative threshold function, to eliminate all low values, whether positive or negative, as suggested in Figure 3 f. This produces the threshold oriented response, shown in Figure 3 g, where the unwanted negative peaks have indeed been eliminated. However this threshold has the unfortunate consequence of eliminating legitimate edge responses also, for example the lower contrast vertical edge in the lower half of the image. In other words there is no single threshold value that will eliminate spurious edge signals without loss of legitimate weaker edge responses. This problem can be circumvented altogether by simply omitting the center-surround processing stage, and performing the oriented filtering directly on the input image, as is the practice in image processing algorithms, and as seen in the MLRF model (Lehar 1999 a). This is shown in the lower processing path that leads to the bypass oriented response shown in Figure 3 h. This is just one example in the BCS/FCS model where an adherence to "neural plausibility" both obsfucates the intended processing stages of the model in perceptual terms, and introduces spurious artifacts that are only partially corrected by further complications in the model. The objective of the present modeling approach therefore is to employ a perceptual modeling strategy as discussed in Lehar (1999 a) in order to focus on the computational transformations apparent in perception independent of neurophysiological considerations, in order to express those transformations in the most parsimonious form.
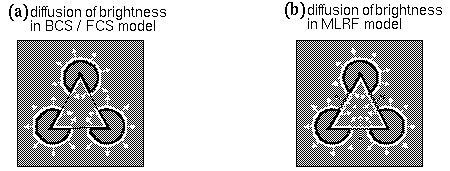
Another significant difference between Grossberg's model and the MLRF concept is seen in the approach taken by these models to the principle of reification. While the cooperative boundary completion in the BCS, and the surface brightness filling-in of the FCS are clearly examples of perceptual reification, Grossberg's failure to recognize these processes as different manifestations of the same general principle precluded a more general treatment of these most significant aspects of his model. In the MLRF model the general characteristic of feedback processing is identified as the principle of reciprocal action (Lehar 1999 a) evident in both boundary completion and surface filling-in. Recognition of this more general principle allows an extension of the concept of collinear contour completion to polar as well as apolar representations, which in turn, allows a correct completion of the illusory contours in the Kanizsa figure, as shown in Lehar (1999 a). In Grossberg's model collinear contour completion occurs exclusively in the apolar processing stream, and therefore there is no contrast signal available across the illusory contours of the figure to produce the correct surface brightness percept. While Grossberg claims to model the Kanizsa illusion, his model replicates only the amodal component of the percept correctly, because the information required for the filling-in is not available in his representation. Consider the brightness signal in the polar boundary image, shown schematically in Figure 2 c. If the brightness signal is free to diffuse except where bounded by the cooperative boundaries shown in Figure 2 g, the brightness signal along the inner perimeter of the illusory triangle will indeed be bounded, to fill in a white percept, as suggested in Figure 4 a. However the background to the figure is also bordered by bright boundaries, and therefore there is no reason to suppose that the triangle should fill-in any brighter than the background. In the MLRF model on the other hand, the polar cooperative completion supplies a contrast polarity to the illusory portions of the triangle, propagated from the non-illusory inducing edges as shown schematically in Figure 4 b. The dark outer perimeter of the illusory figure in turn darkens the brightness of the white background relative to the white interior of the illusory figure.
More generally the principle of reification in the MLRF rearranges the representational levels in the BCS / FCS model when sorted by level of abstraction v.s. reification. This arrangement identifies the surface brightness layer as a lower-level more reified representation than the corresponding polar boundary image. Despite the significant differences between the present approach and Grossberg's model, the models presented in the four papers of this series owe a debt of gratitude to the BCS / FCS model for the innovative concepts introduced by that model which have been incorporated and extended in the present approach.
In the MLRF model presented in the first paper of this series (Lehar 1999 a) the principle of cooperative processing was introduced in rudimentary form to demonstrate how the principle of a directed spreading of oriented signal in an oriented edge representation can account for certain aspects of collinear illusory contour formation. The basic idea of this concept is demonstrated with computer simulations in Figure 5 (from Lehar 1999 a). The input image shown in Figure 5 a is convolved with a bank of oriented edge filters, shown in Figure 5 b to produce a bank of oriented edge responses shown in Figure 5 c. Application of an absolute value function converts negative filter responses to positive resulting in an apolar representation, and a competition between orientations has also been applied, as described in the MLRF model (Lehar 1999 a). The entire three- dimensional data structure of Figure 5 c is known as the apolar oriented image, and it corresponds approximately to the stage of the BCS model depicted in Figure 2 e. The oriented image is then convolved, plane for plane, with a cooperative filter shown in Figure 5 d, to produce the apolar cooperative image shown in Figure 5 e. For example the vertical plane of the apolar oriented edge image is convolved with the vertical orientation plane of the cooperative filter shown in Figure 5 d, which produces a vertical blurring of that image as shown in Figure 5 e. This oriented blurring tends to link up edge fragments that are in a collinear configuration. The total effect at all orientations can be seen more clearly in Figure 5 f, which represents a summation of all of the orientation planes of Figure 5 e, as described in Lehar (1999 a). The summed image shown in Figure 5 f is known as the apolar boundary image, and the corresponding image in the BCS model is used to bound the diffusion of brightness signal in the FCS processing.
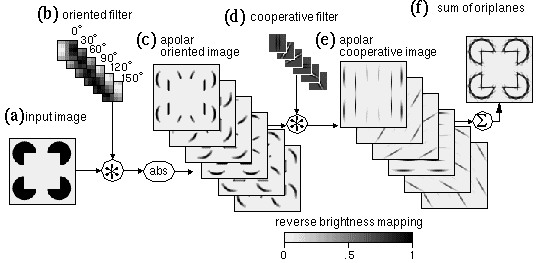
Within certain limits this simplified model of cooperative processing is consistent with the first order properties of illusory contour formation. For the strength of the oriented edge response shown in Figure 5 c is a function of the contrast of the corresponding edge in the input image, and therefore will influence the strength of the corresponding illusory contour in Figure 5 e. The strength of the illusory contour will also increase as a function of the length of the inducing edge, because an edge that is shorter than the cooperative filter will produce a weaker cooperative response than an edge that extends throughout the whole filter. Similarly, the strength of the illusory contour will weaken as a function of separation between inducing edges, because at greater separation there is less overlap between cooperative responses extending from inducing edges from opposite sides of the gap. A single pass of cooperative filtering therefore appears at first sight to be an acceptable model of the first order properties of illusory contour formation. However there are a number of artifacts present in this image, as mentioned in Lehar (1999 a). In the first place, the edges of the illusory square in Figure 5 f overshoot beyond the corners of the square. This effect is a consequence of the collinear nature of the processing, which is by its nature unsuited to representing corners, vertices, or abrupt line-endings, and a similar collinear overshoot is observed where the circumference of the pac-man feature intersects the side of the illusory square. Another prominent artifact is a star-shaped pattern around the curved perimeter of the pac-man features. This is due to the quantization of orientations in this example into 12 discrete directions (6 orientations), each orientation plane (henceforth contracted to oriplane) of the cooperative filter attempting to extend a piece of the arc along a tangent to the arc at that orientation. Most of these problems in the cooperative image result from a spatial averaging, due to the use of large scale cooperative filters. This issue will be addressed in the next section.
In the single-pass model of cooperative processing presented above, the maximum range across which illusory contours can form is limited by the length of the filter used. In the simulations shown in Figure 5 the filter was conveniently adjusted to match the separation in this example image. However illusory contours are observed to form across many degrees of visual angle. This requires very large spatial scale filters to replicate the properties of perceptual completion. However the use of large scale filters inevitably results in a spatial averaging in the response. In fact it is spatial averaging that is responsible for the star-shaped artifacts observed in the curved portion of the figure shown in Figure 5 d. The reason for these spurious features is that the filter produces a response whenever any portion of the filter overlies a visual input. The effect of this is that every local portion of the circular arc is extrapolated outwards by the cooperative filter along a tangent, only a small part of which corresponds to an actual edge. One solution is to expand the shape of the filters into a "bow-tie" shape, shown in Figure 6 b, which is the shape suggested by Grossberg & Mingolla (1985) to offer a better overlap between filters of adjacent orientation along the curved contour. Note that this filter does not have the negative sidelobes of the filter shown in Figure 5 d. The problem with this approach can be seen in Figure 6 c, which shows the result of convolution of the vertical oriplane of the oriented image shown in Figure 6 a with the vertical oriplane of the bow-tie cooperative filter of Figure 6 b, i.e. this response should be compared to the vertical oriplane of Figure 5 e. The sum of oriplanes of bow-tie cooperative filtering is shown in Figure 6 d, which should be compared to Figure 5 f. This approach does indeed eliminate the star-shaped artifact, but in the process it introduces a considerable spatial blur. The reason behind the problem of spatial averaging is shown schematically in Figure 6 e, where the two dark vertical lines represent a pair of vertical oriented edge signals like those in Figure 6 a. The black bow-tie outline in Figure 6 e represents a vertical cooperative filter that spans the gap between the oriented edges, producing a vertical cooperative response at the center of the filter, at the location of the small black circle. Due to the spread of the bow-tie filter however, there would be many other cells at adjacent locations, such as those indicated in light shading in Figure 6 e, that would also produce a significant response between those same oriented edges, resulting in a broad fuzzy response pattern as seen in Figure 6 c. Grossberg argues that this spatial blur can be corrected by further processing in the feedback loop involving lateral inhibition. This corresponds to a spatial sharpening filter used in image processing algorithms to correct blur in an image.

Another possible solution is to increase the number of orientations in the oriented processing. Figure 7 demonstrates the same cooperative processing as in Figure 5 except using 24 discrete oriplanes representing 48 orientations, rather than the 6 oriplanes representing 12 orientations that was used in Figure 5. Again, while there is some improvement in the appearance of the star-shaped artifact, this is only because the star has now been blurred into a complete halo around the arcs, expanding each arc into a fat and fuzzy curve. The principle of this spatial spreading is depicted schematically in Figure 7 b, where the light shaded ellipses represent regions within which cooperative cells of the corresponding orientations respond at least partially to input from the curved edge stimulus. There is further evidence of spatial averaging at the corners of the square, where the sides of the square overshoot into a fuzzy spray of energy in all directions. The explanation for this phenomenon is that the vertical and horizontal oriented edge signals present simultaneously at the corner stimulate a broad array of cooperative cells at that point, suggested in Figure 7 c. While some of this fuzziness can perhaps be corrected by feedback and competition, as discussed later, the problem of spatial averaging is inherent in the use of large scale filters for cooperative processing.

Grossberg & Mingolla (1985) suggest that the problem of spatial averaging, and in particular the problem of overshooting of cooperative boundaries out beyond the end of detected edges can be addressed by ensuring that the cooperative processing produces a response only when the cooperative filter is spanning regions of oriented activation, with the two lobes of the filter receiving activation from opposite sides of the gap. This can be achieved by installing a functional AND-gate between the two lobes of the bipolar filter, so that if either lobe of the filter is receiving zero input, then the output of the filter as a whole will be zero. Lehar & Worth (1991) have dubbed this requirement the conjunctive constraint. Although Grossberg's implementation of this concept is somewhat more complex, the principle can be demonstrated as follows. First, the cooperative filter is disassembled into two separate lobes, as shown for the vertical oriplane in Figure 8 a and b, each lobe resembling an upright or inverted "plume". Next, the oriented image is convolved separately with each lobe of the filter producing the two responses shown Figure 8 c and d. Note how every point of oriented activation is spread into the plume shape of the corresponding filter lobe. Finally, a "soft conjunction" or fuzzy-logic AND operation is performed by multiplying the two images, pixel for pixel to produce the conjunctive vertical response shown in Figure 8 e. Grossberg's version of this conjunction operation would be similar to applying a hard threshold through the gray regions in Figure 8 c and d, producing a more binary result. Figure 8 f shows the sum of oriplanes of all of the conjunctive responses calculated in this manner. It is clear that this processing has greatly improved the problem of the star-shaped artifacts, and the curved contours have been reduced to thin arcs. However there are still residual problems with this image, which reveal important theoretical limitations.
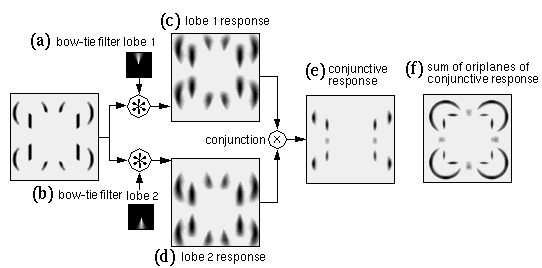
In the first place, the illusory contour in Figure 8 f does not connect the inducing edges completely, but leaves small gaps at either end. Even with reduced separation between the inducers, although the gap would at least be closed, the strength of the cooperative response would still peak at the center of the illusory contour, and fade towards the inducers, which is the reverse of the pattern observed in the percept, where the contour appears most salient where it abuts its inducing edges, and fades towards the center of the contour. This problem is a consequence of the conjunctive constraint as shown schematically in Figure 9. The peak response will be attained by the filter that is located at the center of the gap, as shown in Figure 9 a, where the peak response region is depicted in light shading. From this point, if the filter is displaced towards either inducer, as shown in Figure 9 b, although receiving a stronger input from the nearer inducer, it receives a weaker response from the more distant inducing edge, which in turn gates the response of the cell as a whole. Therefore the peak response is not observed near the ends of the inducers, but at the central point between them. Grossberg's proposed solution to this problem is to suggest that the entire BCS model be replicated at multiple spatial scales, so that the residual gap between the peak response and the end of the inducer would be completed by a smaller scale cooperative filter that spans the gap between the central peak and the inducers in either direction, as suggested schematically in Figure 9 c. However the exact formula of interaction between the different scales of this multi-scale BCS model has not been fully defined. This is by no means a trivial problem, because due to the problem of spatial averaging, the response at the very largest scale would create large fuzzy regions of activation encompassing both inappropriate or spurious edge signals as well as the ones that should be stimulated. If the different scales are combined additively, this would allow smaller scale filters to complete throughout those fuzzy regions, thereby nullifying much of the benefit of the conjunctive constraint. If on the other hand the different spatial scales are combined multiplicatively, i.e. requiring completion at all scales simultaneously, then a gap at the smallest spatial scale would be sufficient to block completion across that gap.

Another problem with the cooperative response shown in Figure 6 d and e is the fuzzy spatial extent of the peak. This again is a consequence of spatial averaging due to the large scale and lateral spread of the cooperative filters used. Although the present analysis of the limitations of cooperative filtering is in terms of a single pass convolution, the BCS model, and also the MLRF model are intended as feedback models, and therefore the problems of spatial averaging outlined here could in principle be addressed by corrective measures such as spatial sharpening and competition between orientations in the feedback loop. Nevertheless, the single-pass cooperative response represents a derivative, or the direction of change in each iteration, and therefore the more clean and correct this response can be made, the less corrective measures need be incorporated at other levels of the model. In fact, it will be shown that the problem of spatial averaging can be addressed by using much smaller scale cooperative filters, but allowing these local cooperative responses to link up with each other by way of positive feedback, or mutual support, as suggested by the principle of reciprocal action. In other words the large scale properties of illusory contour formation can be contrived to emerge under the simultaneous action of multiple local forces in parallel, as suggested by the principle of emergence in Gestalt theory.
Feedback in any computational model poses stability problems due to a tendency towards runaway positive feedback. In this case a contour that begins to emerge will subsequently feed on its own strength, and thereby tend to grow out of control until the entire image is swamped with self-stimulating edge signals. A feedback model must therefore be carefully balanced in order to prevent runaway positive feedback. Grossberg employs a number of such balancing forces in the form of lateral inhibition across spatial location, (i.e. spatial competition) and further inhibition between different oriplanes at the same spatial location (i.e. oriented competition). The effect of spatial competition in Grossberg's model is similar, in each iteration, to a de-blurring operation used in image processing, or a convolution with a center-surround filter, that amplifies the differences between a pixel and its neighbors, thereby condensing broad fuzzy regions of response to sharper isolated peaks. A better spatial competition for cooperative processing is incorporated in the cooperative filter shown in Figure 5 d, in the form of negative side-lobes, because this filter sharpens only in the direction orthogonal to the orientation of the cooperative filter, and therefore this sharpening does not oppose the essential function of cooperative processing which involves a blurring in the oriented direction. The spatial competition of the MLRF model therefore tends to form long streaks rather than sharp points of activation, those streaks being aligned in the oriented direction. A form of oriented competition was also described in the MLRF model (Lehar 1999 a).
Another essential stabilizing influence found in Grossberg's model is the use of dynamic shunting neurons in the representation, to limit neural values between fixed bounds, for example between 0 and 1 for apolar representations, or -1 and +1 for polar representations. The shunting term therefore can be seen as the dynamic equivalent of a sigmoid function used in static neural network models, since even with very large inputs, or with positive feedback, the neural activation can never exceed its maximal value, and therefore the maximum input of a neuron from itself can be controlled. The shunting equation is given by

|
(EQ 1) |
where x is the value of a dynamic node in the neural network, corresponding to a single pixel in a neural vision model. The value I represents sum total of all excitatory and inhibitory input arriving at that node, for example as the result of spatial convolution from another layer of nodes.The functions pos(I) and neg(I) return only the positive or negative portion of their argument I, or zero otherwise. Therefore only one of these two functions can be non-zero in Equation 1 for any given input I. The excitatory shunting term (1-x) gates the excitatory input to zero as the nodal activation value x approaches its maximal value or upper bound of +1, while the inhibitory shunting term (x) gates the inhibitory input to zero as the nodal activation approaches zero, thereby preventing the activation from dropping below zero even in the presence of large inhibitory inputs. The decay term -Ax ensures that in the absence of input the nodal value will decay to zero, like air pressure in a leaky balloon. The properties of the shunting equation can be understood intuitively by solving at equilibrium which gives

|
(EQ 2) |
for positive input I, and zero for negative input. Figure 9 d plots (in the solid line) the equilibrium value of x for a range of input values I, showing how the equilibrium equation defines the positive half of a sigmoid function that saturates at the upper bound value of +1. The dashed line in Figure 9 d shows the other half of this sigmoid function for polar representations that range in value between -1 and +1, using a polar variation of the shunting equation. In discrete time computer simulations the equilibrium value can be computed in each computational iteration, which is equivalent to applying the above sigmoid function.
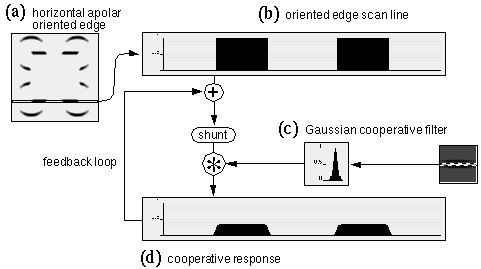
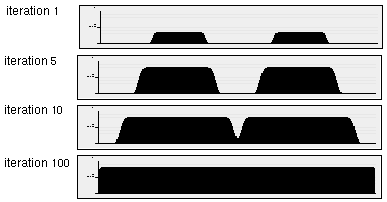
In this section the properties of the shunting equation will be examined in a feedback model in order to develop a model of large scale cooperative completion by way of small scale cooperative filters applied iteratively in a feedback loop. Figure 10 a depicts the horizontal oriplane of the oriented response, and Figure 10 b represents a one-dimensional slice through a single scan-line of this image along the line of the horizontal inducing edges of the Kanizsa figure. The two regions in Figure 10 b therefore correspond to the two horizontal inducing edges in Figure 10 a, although these responses are idealized as sharp square-wave functions to emphasize the effects of cooperative processing. Figure 10 c shows a horizontal scan-line taken through the center of the horizontal oriplane of a cooperative filter, revealing a Gaussian profile. Convolution of the one-dimensional oriented image of Figure 10 b with the Gaussian filter of Figure 10 c produces the cooperative response shown in Figure 10 d. Since the scale of the cooperative filter used here is significantly smaller than the gap between the inducing edges, the cooperative response does not span the gap between the inducers, but only introduces a small spatial spread in the oriented signal. In the feedback loop, this cooperative response is combined with the oriented input by a weighted sum, and a shunting equation is applied to the resulting sum to bound the activation. Then the shunted image is convolved again with the cooperative filter, and the process is repeated a number of times. Figure 11 shows the effects of this repeated cooperative convolution after 1, 5, 10, and 100 iterations. Note how the repeated filtering does indeed continue to spread the activation in the horizontal direction, although the shunting term keeps the activation bounded between the values zero and 1. However the cooperative signal propagates in both directions, rather than exclusively inwards between the inducers, and the system saturates with a uniform activation throughout the cooperative edge. Increasing the decay constant A in equation 1 merely reduces the overall activation at equilibrium, but does not prevent the uncontrolled propagation of edges observed in Figure 11. Therefore the simplified approach to feedback presented in the MLRF model (Lehar 1999 a) must be elaborated to prevent this kind of saturation. In the BCS model this problem is addressed by the conjunctive constraint which prevents the outward completion. However the conjunctive constraint requires much larger scale filters which results in spatial averaging.
Lehar (1994) proposes an alternative approach based on the concept of a directed diffusion of oriented activation, in a manner that is exactly analogous to the diffusion of brightness signal in the FCS model (as described in simplified perceptual modeling terms in Lehar 1999 a) except that this diffusion is channeled in the oriented direction by the cooperative processing. Conceptually, the difference between diffusion and an iterated cooperative convolution is that in the latter case the output of the filtering is combined with the input signal at each iteration, thereby losing the distinction between the original input and its cooperative extension. This is what allows unlimited growth of edges from an original source. In the diffusion model on the other hand, the diffusion spreads outwards from a fixed input pattern which therefore limits the final extent of the diffusion, which is determined by the length and contrast of the inducing edge. Computationally this concept is implemented as follows. The cooperative filter is separated into two lobes, as in the conjunctive constraint, and the oriented input is convolved with each lobe of the filter individually. The value of the cooperative response at each point is then computed as the average of the response of the two lobes. This concept is illustrated in its simplest form for the one-dimensional case in Equation 3, where the response of the node xi is computed exclusively from the nearest adjacent nodes xi-1 and xi+1, as well as from the local input signal Ii.

|
(EQ 3) |
The diffusion term drives the derivative to reduce the difference in activation between the local node xi and the average activation of its adjacent neighbors; in other words a node surrounded by more active nodes will tend to increase in activation, while nodes surrounded by less active nodes will diminish in activation. The result is that activation will tend to spread from one node to the next by diffusion from sites of oriented input. At equilibrium therefore, every node not receiving input directly will take on the average activation of its two adjacent neighbors, with the result that the equilibrium pattern of activation defines a decaying function extending outwards from regions supplied with input. The decay term limits the spread of this activation by depleting the activation at each node, thereby reducing the activation with distance from an oriented input. In order to avoid pixel effects due to spatial quantization, the activation of neighboring nodes is sampled across a wider area through the two lobes L and R of the cooperative filter, as defined in Equation 4, where each lobe represents one lobe of a bipolar Gaussian cooperative filter.

|
(EQ 4) |
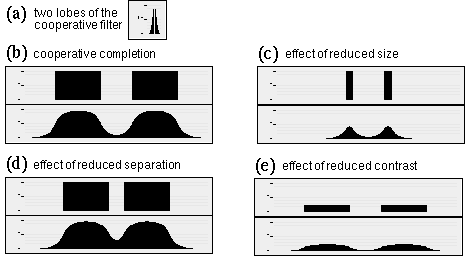
Figure 12 shows the results of computer simulation of the Directed Diffusion model in one dimension. In all of these simulations rapid growth was observed in about the first 50 iterations, which slowed to a stop at about 100 iterations beyond which no further change was detected to the resolution of these displays, although the simulation was allowed to run out until 200 iterations. Figure 12 a shows the left and right lobes of the cooperative filter used in these simulations, showing how the range of cooperative filtering is considerably shorter than the range of the diffusion at equilibrium. Figures 12 b through e show simulations under various conditions, with the oriented input pattern displayed above, and the corresponding pattern of diffusion shown below. Figure 12 b shows the response of the Directed Diffusion model to two inducing edges, resulting in an illusory contour spanning the two inducers, with a salience profile characteristic of the illusion, i.e. with maximum salience near the inducers, and a progressive decline in salience with distance from the inducers. This response can be compared to the two-dimensional simulation response shown in figure 18 a. Figure 12 c shows the effect on this contour of reducing the length of the inducing edges while maintaining the same spatial separation. These shorter edges are not capable of maintaining the same high level of activation as seen in Figure 12 a, and the magnitude of the illusory contour is correspondingly diminished. This is consistent with the psychophysical finding that the salience of the illusory contour is a function of the length of the inducers. Figure 12 d shows the effect of reducing the spatial separation between stimulus edges, showing how the closer diffusion between the inducers results in a more salient contour, as observed also psychophysically. Finally Figure 12 e shows the effects of reduced inducer contrast, which again has the effect of diminished diffusion resulting in a weaker illusory contour, as observed psychophysically.
What has been demonstrated in the above simulations is that the large scale behavior observed in large scale cooperative processing can be replicated qualitatively using much smaller filters and feedback. By itself, this feedback processing may not seem to offer much more than the large scale filtering, since the cooperative results shown in Figure 12 exhibit similar spatial averaging. It will be shown in the next section however that the feedback nature of this cooperative processing by diffusion allows the process to behave like a flexible or elastic template that can bend to conform to the configuration of the input, thereby eliminating one aspect of the problem of spatial averaging, i.e. the difficulty of cooperative completion around smooth curves, such as the curved Pac-man features in the Kanizsa figure.
The discussion presented thus far focused on the first order properties of illusory contour formation, i.e. the variation in the salience of the illusory contour as a function of contrast, size, and spatial separation. We next come to the issue of second order properties, or the behavior of the illusory contour in response to various misalignments between the inducing edges. There are two models that have addressed this issue at some length, the BCS model of Grossberg et al (1985), and a model presented by Zucker et al. (1988). In both of these models the cooperative filter is adapted specifically to perform smooth completion around curves, although there are significant philosophical differences between the approach taken in those two models. I begin with a discussion of the properties required of the cooperative filter in order to respond correctly to curvature, and the various trade-offs involved. I will then show how the Directed Diffusion approach avoids many of the problems of curve completion by the same general Gestalt approach, i.e. by allowing the complexity of the behavior of the model to emerge from simple local interactions, rather that being hard-wired in a more complex architecture.
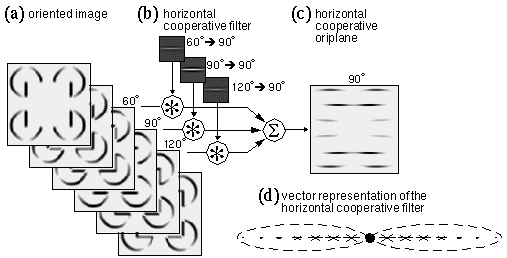
Consider the curved Kanizsa figure shown in Figure 1 b. Generally, what is required in the model is a certain orientational tolerance to allow a contour of one orientation to be supported by inducing edges of a similar or adjacent orientation. For example, in the case of the horizontal base of the curved Kanizsa triangle of Figure 1 b, the horizontal cooperative response must be sensitive to off-horizontal orientations. In the discrete case using 12 orientations, the horizontal response should be calculated from edges in the 60° and 120° oriplanes of the oriented image, as well as the 90° plane. This is shown schematically in Figure 13, where the horizontal cooperative filter, formerly consisting of a single orientation plane, is now shown in Figure 13 b composed of three discrete oriplanes, each of which is convolved with the corresponding oriplane of the oriented image shown in Figure 13 a, and the results are summed to produce the single horizontal cooperative response shown in Figure 13 c. Since the salience of the illusory contour is diminished as a function of inducer misalignment, the input from adjacent orientations should have a lesser influence on the contour than input from the central orientation, i.e. the filter values in the adjacent oriplanes should be less than those in the horizontal oriplane, as suggested by the lower filter magnitudes for the adjacent orientations in Figure 13 b, although in this simple example the filter function is otherwise identical in the three filter planes. In a continuous orientation representation the response to adjacent orientations should fall off as a function of deviation from the central orientation, for example as a cosine function, as suggested by Grossberg & Mingolla (1985). For simplicity in the presentation, only discrete orientations are described below, depicted at discrete sample points in the cooperative receptive field, although these discrete filters represent continuous field-like influences as suggested by Gestalt theory. A discretely sampled filter can be depicted schematically in a single plane using a vector representation as shown in Figure 13 d, where the central black circle represents the location of a cooperative node whose "receptive field" from the oriented layer is depicted as two dashed ellipses, within which the short oriented line segments represent the sensitivity of that filter to different oriplanes of the oriented image at discrete sample points. For example the horizontal line segments in Figure 13 d represent sensitivity to the horizontal oriplane at each sample point, the length of each line segment being proportional to the magnitude of that sensitivity at different points within the filter, showing in this case a reduced sensitivity with distance from the center of the filter, as suggested by the Gaussian function g3 in equation 5. For simplicity the negative filter values are not represented in this figure, and will not be considered in the present discussion. The short line segments in Figure 13 d oriented at 60° and 120° represent a sensitivity of this filter to those orientations respectively, the diminished length of those vectors representing a diminished sensitivity to those orientations. Figure 14 a suggests schematically how this filter would produce a response in a horizontal cooperative node that is located along the horizontal line connecting the angled Kanizsa inducers. In a continuous field of this sort, the strength of the horizontal cooperative response would fall off smoothly as a function of inducer separation and inducer alignment, as observed in psychophysical studies. This model however would predict a peak response along the horizontal line joining the inducers, as depicted in Figure 14 a, rather than somewhat higher, along a smooth curve that is tangent to the inducing edges, where the illusory contour is actually observed to appear.
Besides tolerance to orientational deviation, the cooperative cell can also be given increased spatial tolerance by increasing the spatial spread of the filter function as shown schematically in Figure 14 b, in this case with the same orientational tolerance as before throughout the filter. This would allow a weaker response at points both above and below the line joining the inducers, but again the peak response would occur along the horizontal line joining the inducers. In order to produce a more natural contour that is tangent to the inducing edges, the spatial and orientational tolerance can be made to covary in some meaningful manner throughout the filter. Zucker et al. (1988) propose the criterion of cocircularity to govern this covariance, i.e. that the peak orientation response should be defined by an arc segment of the appropriate curvature and orientation, as suggested schematically in Figure 14 c, where the light shaded curve represents a circular arc segment. Zucker et al. (1988) propose a whole bank of cooperative filters through a range of different curvatures for each orientation, as suggested schematically in Figure 14 d, where the centers of the five depicted filters would in reality be superimposed at the same location, but would have separate nodes for each degree of curvature at that spatial location. Zucker et al. (1988) propose that these cooperative cells serve not only to perform curved contour completion, but in fact these cells serve as feature detectors tuned to detect their specific curved feature.
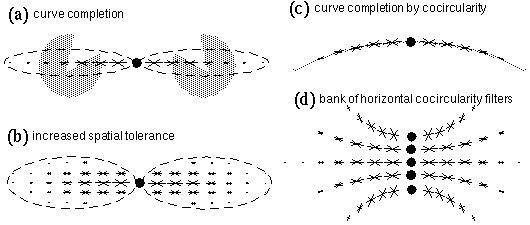
Grossberg & Mingolla (1985) propose a different approach to curve completion by way of a generalized curve filter, as suggested schematically in Figure 15 a. This filter might be described as a combination of all of the filters of different curvature shown in Figure 14 d in a single filter. Activation of this cooperative cell therefore would not determine whether it was being stimulated by a line of positive, negative, or zero curvature, since that information is lost in the summation process. These two approaches to curve completion represent different philosophical approaches to the nature of visual processing. The model proposed by Zucker is consistent with a hierarchical feature-detector model in which vision is understood as the lighting up of various detector nodes in the visual hierarchy that correspond to features present in the visual scene. A major difficulty with this whole approach to visual modeling is that it is no different in principle from a template matching scheme, and thereby leads towards a combinatorial explosion in the number of specialized feature detectors required to detect the presence of a particular feature. For example curve detectors would have to be postulated at every location in the visual field, at every represented curvature, and at every possible orientation. More complex compound features such as corners or vertices would require even more dimensions of specificity to encode their detected features. The approach taken by Grossberg on the other hand represents the Gestalt approach, in which the purpose of a curve completion cell is not so much to recognize and report its detected presence, but rather its primary function is to complete that curve isomorphically with the percept as observed. When a curved contour is experienced in a Kanizsa figure, the isomorphic model must replicate that experienced curve with a curved data structure whose contrast, spatial resolution, degree of curvature, etc. reflect the properties of the percept itself.

From the perspective of Gestalt theory, the problem with both Grossberg's and Zucker's models of curvature completion is that the complex behavior of the illusory contour is modeled by a receptive field whose complexity is similar to that of the phenomena it attempts to explain. As discussed earlier, the large spatial scale of the cooperative filter leads to problems of spatial averaging which precludes the formation of a sharp contour in response to a curved input. Gestalt theory on the other hand favors an emergent mechanism in which the complexity of perceptual phenomena is greater than that of the simple local interactions that give rise to them. The formation of illusory contours can be compared to the bending of a flexible wooden spline between clamped end points, that represent the oriented inducers, as suggested in Figure 15 b. For the spline, like the soap bubble, attains its smoothly curving shape not by selecting from an array of templates designed to match every possible curvature, but rather by applying a bending force to a flexible template, whose natural elasticity distributes that force uniformly along its length, producing an emergent smooth curve. This property can be added to the Directed Diffusion model presented above simply by endowing the small scale spatial filters with a certain amount of orientational tolerance, i.e. allowing filters of one orientation to respond to adjacent orientations, and allowing the feedback in the model perform the completion of the curve.
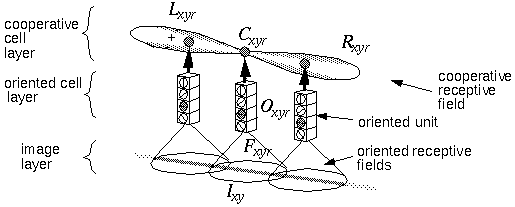
The architecture for the two-dimensional simulation of the directed diffusion is depicted in Figure 16. An input image is projected onto the image layer which consists of a two dimensional matrix of cells Ixy. Cells Oxyr in the oriented layer receive activation from the input layer by way of oriented receptive fields centered at location (x,y), and with orientation r. This is accomplished by way of spatial convolution of the input image with the oriented filters, such that

|
(EQ 5) |
where Fijr is the oriented edge detector. The absolute value function in this equation results in an apolar oriented response. Oriented cell activation is sampled by the left and right lobes of the cooperative cell receptive fields, described by the functions L and R as defined below.

|
(EQ 6) |

|
(EQ 7) |
Each of these functions is made up of a product of two terms. The first term is a difference of Gaussians as a function of deviation from the central orientation r, with a standard deviations of s1 and s2, where s2 = 1.6 x s1.This function produces a peak along a line of orientation r with negative side lobes. The second Gaussian, known as the radial term, decays with increasing spatial separation from the center of the filter. The product of these two terms defines a two-dimensional oriented filter that extends outward in the oriented direction.
The only difference between the equations for L and R is in the exponent of the orientational Gaussian term, which determines the direction of the filter, such that the orientations of L and R differ by p. The arctangent function used in these equations is the two argument atan2 function, as defined by:

|
(EQ 8) |
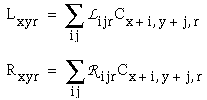
A cooperative cell Cxyr at location (x,y) and of orientation r receives input both directly from the oriented cell Oxyr at location (x,y) and orientation r, as well as through the "left" and "right" lobes of its bipolar receptive field Lx,y,r and Rx,y,r from adjacent cooperative cells of the same orientation:
|
(EQ 9) |
The resultant activation of the cooperative cell is governed by the shunting equation

|
(EQ 10) |
In this equation, the first term is the passive decay term governed by the decay rate A, a positive constant. Following this is a difference of two terms that represents the difference between the activation of the cell Cxyr and the average activations in the regions of the cooperative layer governed by the left and right lobes of the cooperative receptive field, where N is a normalizing constant. In the absence of direct input from the oriented layer, this differential equation tracks the difference terms to equilibrate at an activation between the average activations in the two lobes. As for the 1-dimensional case, if the decay term A is zero, the equilibrium point is exactly midway between the neighboring activations, resulting in a linear interpolation. The last term in Equation 10 is the direct input from the oriented layer, which biases the equilibrium state towards the pattern of activation present in the oriented layer. In the computer simulations, the equilibrium value of Equation 10 was used, which is in the form

|
(EQ 11) |
The sensitivity of the cooperative cell to adjacent orientations was implemented in a simplified manner. Instead of defining separate filters to sample adjacent orientations as suggested in Figure 13, each cooperative cell receives activation through its own receptive field, and additional activation from cooperative cells of adjacent orientation, i.e. there is a certain cross-talk or diffusion of response between cooperative filters of nearby orientations, as if by a diffusion of activation in the cooperative image across the orientation dimension. In the two-dimensional simulations this was accomplished as follows. First, the filter response is computed for each oriented filter as described in Equations 8 and 9, i.e. each oriented filter receives input exclusively from like oriented cooperative cells. Then, the filter response is modified by a diffusion across the orientation dimension using the formulae

|
(EQ 12) |

|
(EQ 13) |
where the left arrow symbol represents the assignment operator, i.e. the new value on the left side of the assignment is computed from its previous value on the right at each iteration. The parameter f is a small positive diffusion constant. In this manner, for example, a strong horizontal oriented response would stimulate a weaker response in both adjacent orientations, and in the next iteration those adjacent responses would diffuse to more distant orientations with still further diminished magnitudes, as suggested in Figure 15.
Figure 17 shows the results of a computer simulation of the directed diffusion system, where the activation in the cooperative layer is plotted in response to two horizontal inputs at various separations in reverse brightness mapping. Figure 17 a shows the equilibrium activations for inputs separated by 10, 15, and 20 pixels, with a decay rate value of A = 0.01. In this simulation the oriented inputs were presented as single points of activation of a single orientation only, to demonstrate the principles of completion more clearly. The location of the inputs is indicated by an overlaid circle with a bar at the orientation of the input signal. Note that the salience of the illusory contour diminishes as the separation between the inducers is increased, as observed in the psychophysical data reported above.
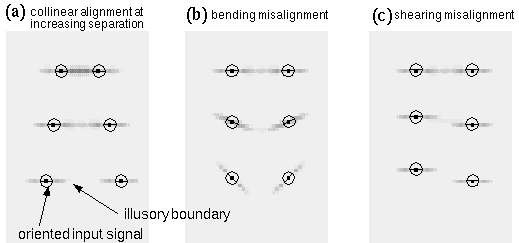
Figures 17 b show the response of the cooperative cells to two oriented inputs as a bending misalignment is applied. The strength of the illusory boundary is seen to diminish smoothly as a function of the angle of the misalignment. Figure 17 c show the response of the cooperative cells to two oriented inputs as a shearing misalignment is applied, i.e. as the parallel inducers are shifted laterally relative to one another. The strength of the illusory contour is seen to diminish rapidly even at very small shear values, as observed psychophysically (Kellman & Shipley 1991). The second order properties of illusory contour formation can therefore be replicated with a relatively simple diffusion model whose properties emerge from simple local interactions rather than being hard-coded into the pattern of a complex receptive field. The relatability criteria of Kellman & Shipley (1991) are handled quite naturally by this mechanism because the collinear signal diffusing from inducers in a bending misalignment naturally intersect in space, where they tend to connect with each other and bend smoothly into a spline-like illusory contour. In the case of the shearing misalignment on the other hand, the outward diffusing signals do not cross in space and therefore will fail to join together, except for small shear values. The results shown in Figure 17 are qualitative in nature, but the relevant parameters of the model can be easily adjusted to match the results of psychophysical experiments. For example the tolerance to bending mis- alignment can be adjusted by varying the cross-talk between adjacent orientations with the parameter f in Equations 12 and 13. The tolerance to shearing mis-alignment on the other hand is adjusted by varying the spread of the orientational Gaussian function, or s1 and s2 in Equations 14 and 15. This model therefore offers a mathematical framework for a precise quantified description of the observed properties of illusory contours.
Figure 18 a shows the results of Directed Diffusion performed on the complete Kanizsa figure, using the oriented input shown in Figure 5 c. Note how the small scale filtering used has completely eliminated the star-shaped artifacts around the curved perimeters of the pac-man figures, because no single filter extends significantly beyond the curved perimeter, and yet long range completion occurs emergently around that curved perimeter because the orientational tolerance allows adjacent cooperative filters to receive activation from adjacent orientations. Despite the short scale of the filters used, long range collinear completion is observed across the gap between the inducers, forming the sides of the illusory square. The emergent nature of this contour is revealed by comparison with Figure 18 b, where the upper two pac-man features have been removed. The vertical contours extending upwards from the lower pac-men therefore have no counterparts with which to link up, with the result that these vertical contours remain weak. This can be demonstrated more clearly by applying a threshold, as shown in Figure 18 c, which preserves the lower horizontal contour while all but eliminating the upper vertical contours.
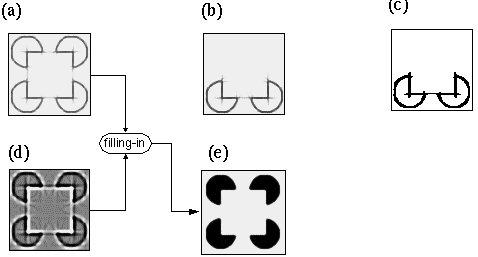
A polar version of the Directed Diffusion model can be defined, in a manner similar to the polar version of cooperative processing described in the MLRF model (Lehar 1999 a). This produces the polar boundary image shown in Figure 18 d. This result now shows the proper completion of the illusory contour in polar form, which allows for the brightness diffusion of the FCS to fill-in the proper brightness difference across the illusory contour. Figure 18 e shows the result of FCS processing using the apolar and polar boundary images of Figure 18 a and d respectively.
The Gestalt approach offers useful insights into the computational interactions apparent in perceptual phenomena. The receptive field models proposed by Zucker et al. (1988) and Grossberg et al. (1985) are constructed with an architecture whose complexity matches the complexity of the behavior they are designed to explain, i.e. with a size to match the size of the gap across which completion is observed, and with an orientational response profile to match the bending and shearing properties of the illusory contour. In the Directed Diffusion model on the other hand the individual filters are much simpler, since they model only a portion of the illusory contour, and the complexity of the completion phenomena are an emergent property of the simple local interactions between cooperative units. Instead of a rigid template to encode the behavior of all possible contours, a region of the Directed Diffusion model behaves like an elastic template that reconfigures itself to conform to the configuration of the input. Thereby a single spatial mechanism can behave in a multitude of variations, equivalent to a whole array of specialized receptive field templates. This highlights the real power of the Gestalt approach, because it suggests that the nature of the computational mechanism can be simpler than the global emergent properties it engenders, just as the local forces of surface tension are very much simpler than the full range of possible configurations of bubble surfaces. Gestalt theory therefore suggests a more general principle of neurocomputation, that complex perceptual phenomena do not necessarily imply equally complex computational mechanisms, but rather that nature makes use of the most complex behavior that can possibly be elicited from any given neural architecture. Therefore a simple circuit or structure identified neurophysiologically should not be assumed to be limited necessarily to a simple function.
Banton Tom, & Levi Dennis 1992 "The Perceived Strength of Illusory Contours". Perception & Psychophysics, 52, 676-684.
Grossberg S, Mingolla E, 1985 "Neural Dynamics of Form Perception: Boundary Completion, Illusory Figures, and Neon Color Spreading" Psychological Review 92 173-211.
Grossberg S, Todorovic D, 1988 "Neural Dynamics of 1-D and 2-D Brightness Perception: A Unified Model of Classical and Recent Phenomena" Perception and Psychophysics 43, 241-277.
Kanizsa G, 1979 "Organization in Vision" New York, Praeger.
Kanizsa, Gaetano 1987. "Quasi-Perceptual Margins in Homogeneously Stimulated Fields".. In The Perception of Illusory Contours, Petry S. & Meyer, G. E. (eds) Springer Verlag, New York, 40-49.
Kellman P., J. & Shipley T. F. 1991 "A Theory of Visual Interpolation in Object Perception".. Cognitive Psychol- ogy, 23, 141-221.
Kennedy John M. 1987 "Lo, Perception Abhors Not a Contradiction". In The Perception of Illusory Contours, Petry S. & Meyer, G. E. (eds) Springer Verlag, New York, 40-49.
Lehar S. 1994 "Directed Diffusion and Orientational Harmonics: Neural Network Models of Long-Range Boundary Completion through Short-Range Interactions". Ph.D. Thesis, Boston University. Note: Apply to author for uncensored version of this thesis.
Lehar S. & Worth A. 1991 "Multi-resonant boundary contour system" Boston University, Center for Adaptive Systems technical report CAS/CNS-TR-91-017.
Lehar S. 1999 a "Computational Implications of Gestalt Theory I: A Multi-Level Reciprocal Feedback (MLRF) to Model Emergence and Reification in Visual Processing. Submitted Perception & Psychophysics.
Lehar S. 1999 b "Computational Implications of Gestalt Theory II: a Directed Diffusion to Model Collinear Illu- sory Contour Formation". Submitted Perception & Psychophysics.
Parent P. & Zucker S. W. 1989 "Trace Inference, Curvature Consistency, and Curve Detection". IEEE Transac- tions on Pattern Analysis & Machine Intelligence II (8).
Peterhans E. & von der Heydt R., & Baumgartner G. 1986 "Neuronal Responses to Illusory Contours Stimuli Reveal Stages of Visual Cortical Processing. In J. D. Pettigrew, K. J. Sanderson, & W. R. Levick (Eds.) Visual Neuroscience, 343-351. Cambridge: Cambridge University Press.
Shipley, T. & Kellman, P. J. 1992 "Strength of Visual Interpolation Depends on the Ratio of Physically Specified to Total Edge Length". Perception & Psychophysics, 52, (1), 97-106
Zucker S. W., David C., Dobbins A., & Iverson L. 1988 "The Organization of Curve Detection: Coarse Tangent Fields and Fine Spline Coverings". Proceedings: Second International Conference on Computer Vision, IEEE Computer Society, Tampa FL 568-577.