Plato's Cave: Orientational Harmonic Simulations
Computer Simulations of Orientational Harmonics
The Orientational Harmonic theory makes specific predictions about
interactions between local oriented edges, and about the global
emergent patterns resulting from specific input stimuli. Consider for
example the pattern of vertical lines depicted in the first column of
Figure 6 (A). In the following discussion we will consider only the
first four harmonics of oscillation, which comprise the most
significant response of the system since higher harmonics in a
resonating system tend to be suppressed due to higher impedance at
higher frequencies. Consider a point at the bottom end of one of the
lines in the figure, circled in the magnified view shown in the second
column of Figure 6 (A). The pattern of activation in the cooperative
ring at that location would consist of a strong input at the twelve
o'clock orientation. The first harmonic response to this input pattern
would produce a peak at twelve o'clock, and a negative peak, or
suppression of activation at six o'clock. The second harmonic response
to this same input pattern would attempt to complete the pattern as a
colinear edge, with positive peaks at twelve and six o'clock, and
negative peaks at three and nine o'clock. The third harmonic response
to this same input would consist of peaks at twelve, four, and eight
o'clock with negative peaks in between, and the fourth harmonic
response would exhibit positive peaks at six, twelve, three, and nine
o'clock. Figure 5 (C) illustrates the pattern of these four
harmonics. All four of these harmonic responses would be partially
stimulated by the input at twelve o'clock, although the first harmonic
would find the closest match, and thus would produce the strongest
response. The different harmonics are in a dynamic balance with one
another by constructive and destructive interference between wave
forms in the orientational representation. For example the positive
peak of the second harmonic at six o'clock is balanced by the negative
peak of the first harmonic at that orientation. Also the negative
peaks of the second harmonic at three and nine o'clock balance the
positive peaks of the fourth harmonic at those same orientations. An
increase in any one harmonic will therefore affect the dynamic balance
between all of the harmonics. For example, the presence of a nearby
vertical edge at the six o'clock orientation will produce a weak
activation at that orientation due to the distant influence through
the cooperative receptive fields which, in conjunction with the strong
peak at twelve o'clock would promote the second harmonic or colinear
grouping percept in the vertical direction. This in turn would
suppress the first and the fourth harmonics, as well as the third
harmonic, resulting in a predominantly colinear percept in the form of
a vertical grouping percept. The third and fourth columns of Figure 6
(A) depict the input and output respectively of a computer simulation
of this phenomenon. Unlike the somewhat artificial simulations of the
Directed Diffusion model, these simulations were performed with a
spatial convolution of the input image using a set of orientation
specific edge filters, calculated as described in the appendix. An
orientational harmonic ring was calculated at every pixel location,
and the fourth column of Figure 6 represents the equilibrium
activation of the system for all orientations combined, a dark shade
of grey representing regions of high activation at one or more
orientations. The darkest shades are seen in regions corresponding to
a direct input, for example along the edges of the vertical lines in
the third column of Figure 6 (A). Note that a single line in the
computer simulation input corresponds to a double line in the
simulation output, representing the dark/light and light/dark edges on
either side of that line. The lighter shaded lines in the simulation
output which do not correspond to edges in the input image represent
illusory boundaries or grouping lines stimulated by that input. In the
last column of Figure 6 (A) for instance a strong vertical shading is
observed, corresponding to the strong vertical grouping percept
observed in the figure. Notice also the weaker diagonal and horizontal
lines in the simulation output, repre senting the much weaker third
and fourth harmonic responses respectively. By symmetry, the harmonic
explanation described for the bottom end of each vertical line applies
equally to the top ends of the lines where the same harmonic patterns
occur upside down.
The grouping of vertical lines depicted in Figure 6 (B) promotes a
weak diagonal grouping percept, or an illusory zig-zag edge between
the line endings. This corresponds to the third harmonic response
since the vertex located at the bottom of each line receives distant
activation from the four and eight o'clock orientations as shown in
the magnified view in the second col umn of Figure 6 (B), which is
consistent with the third harmonic pattern. This in turn suppresses
the second and fourth harmonic responses. The computer simulation
output for this figure exhib its this diagonal grouping, although the
effect is rather weak. This is consistent with the fact that the
diagonal grouping percept itself is rather weak.
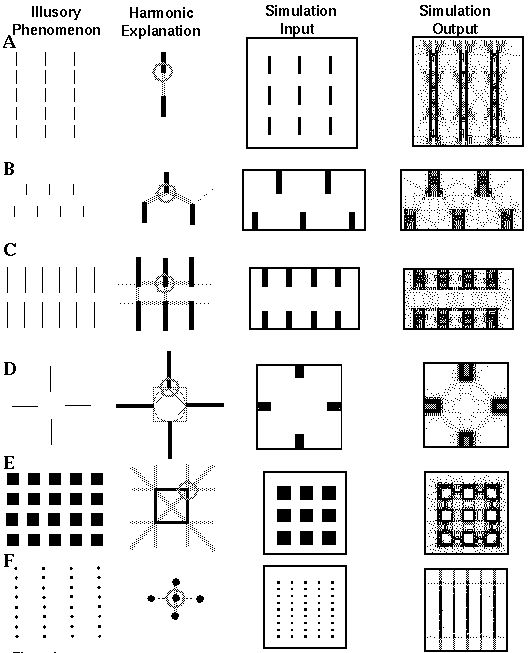
Figure 6 (C) illustrates a horizontal grouping of vertical lines due
to the promotion of the fourth harmonic, because the bottom of each
line ending receives input both from the six o'clock orientation and
from three and nine o'clock, due to fourth harmonic responses at
horizontally neighboring line endings. This simulation illustrates the
Gestalt concept of global emergent properties from local interactions,
because there are initially no inputs from three and nine o'clock,
these inputs are only a secondary effect of an emergent fourth
harmonic response at all the line endings simultaneously. Figure 6 (C)
shows a computer simulation of this phenomenon exhibiting a strong
horizontal grouping percept orthogonal to the line endings. A similar
orthogonal grouping emerges from a single set of parallel line endings
due to fourth harmonic group ing, as is seen in the Ehrenstein
illusion shown in Figure 4 (E). The effect is also seen in attenuated
form at the top and bottom of Figure 6 (A), and also Figure 6 (F),
although it is much suppressed by the second harmonic at the center of
those figures.
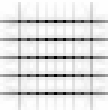
A special case of the Ehrenstein figure is shown in Figure 6 (D) which
is reported by subjects [3] to produce either an illusory circle,
square, or diamond figure. This illusion therefore appears to rest on
a saddle point in perceptual space, which can be perturbed in one of
three stable directions. The appearance of any one of the illusory
figures however precludes the appearance of the other two. The
Orientational Harmonic model explains all of these phenomena by way of
a competition, or destructive interference between the second, third,
and fourth harmonic waveforms. The second harmonic promotes a
colinear completion of the illusory contour orthogonal to the line
ending, corresponding to the circular illusory percept; the third
harmonic promotes a three- way completion at the line ending,
corresponding to the diamond percept, and the fourth harmonic promotes
a four-way completion at both the line endings and at the corners of
the illusory figure, corresponding to the illusory square. The
Orientational Harmonic simulation shown in the last column of Figure 6
(D) exhibits traces of all three of these illusory phenomena.
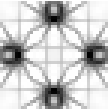
The Orientational Harmonic model also accounts for the illusory
grouping of squares, as shown in Figure 6 (E). At each corner of the
square, for example at the top right corner circled in the magnified
view in Figure 6 (E), the input signal consists of two orthogonal
oriented edges, in this case at six and nine o'clock. The first
harmonic response to this input produces a peak at the internal
bisector of the two edges, i.e. at 7:30 o'clock, which corresponds to
the center of the half-circle containing the greatest oriented
signal. The second harmonic would produce a zero response to this
input, since its positive and negative peaks are separated by exactly
90 degrees. The third harmonic would attempt to align optimally with
the oriented input, with two peaks centered at 5:30 and 9:30 o'clock,
leaving a third peak to define an illusory outward projection
diagonally at 1:30 o'clock, and the fourth harmonic would align two of
its peaks with the six and nine o'clock inputs, leaving two illusory
outward projections at twelve and three o'clock. The Orientational
Harmonic model therefore predicts illusory grouping lines projecting
outward from a square in orthogonal and diagonal directions, as shown
in the second column of Figure 6 (E), corresponding to the fourth and
third harmonics respectively. These two harmonics however compete with
each other by destructive interference, because the diagonal corner
projection of the third harmonic corresponds to the negative peak of
the fourth harmonic between the orthogonal edge projections. An
increase in the strength of the third harmonic would therefore
suppress the effect of the fourth harmonic, and vice-versa. This
competition is seen in the illusory group ing percept of Figure 6 (E),
where the orthogonal alignment of adjacent squares boosts the fourth
harmonic signal at each corner, promoting an orthogonal grouping
percept, which in turn suppresses the percept of a diagonal
grouping. Additional computer simulations (not shown here) reveal that
the removal of alternate squares from this figure generates an
emergent diagonal grouping percept, which in turn suppresses the
perception of an orthogonal grouping.
Finally, Figure 6 (F) demonstrates the size/spacing constraint
discussed by Zucker, [16] whereby a closer vertical spacing of dots
suppresses an equally valid horizontal grouping percept, due to
destructive interference between the second and fourth harmonics,
because the horizontal grouping lines of the fourth harmonic at three
and nine o'clock are suppressed by the negative peaks of the second
harmonic response at those same orientations. Lehar [12] shows that
removal of alternate rows of dots in this figure restores the
horizontal grouping by disinhibition, at the expense of the vertical
grouping, even though the horizontal dot spacing remains
unchanged. The distance-dependant grouping phenomena seen in Figure 4
(B) and (C) are also explained by harmonic interactions, and have been
reproduced in computer simulations [12].
None of the visual phenomena presented in Figure 4 and their
replication in computer simulations provide conclusive proof of the
Orientational Harmonic model. The fact that this model explains all of
these diverse phenomena with a single simple mechanism however makes a
strong case for Orientational Harmonics as a mechanism in visual
perception. A number of the phenomena shown here have been addressed
individually by different models, but no model has yet even attempted
to account for such a diversity of phenomena with a single model. The
phenomenon of colinear boundary completion is the most straightforward
effect, and has been modeled for example by Grossberg's Boundary
Contour System (BCS), [6] Walter's Rho Space, [13] and Zucker's
curvature operators [15]. All of these models have as their central
mechanism some variation of the colinear edge detector cell, which
responds to a colinear (or cocircular) arrangement of local edge
responses of oriented simple cells, in the manner of the Directed
Diffusion model. Some of these models have incorporated some kind of
cooperation or competition between orthogonal orientations at each
spatial location in order to account for orthogonal end- cut effects
as seen in the Ehrenstein illusion of Figure 4 (E), but this kind of
model can never account for the generalized vertex completion
phenomena seen in Figure 4 (A), (B), and (C). In The original BCS
paper [6] Grossberg proposed that the cooperative cell with bipolar
receptive fields might also occur in variations with angles other than
180 degrees between the two lobes- for example "L" vertex and "V"
vertex detectors with 90 degrees and 30 degrees between the two lobes
would account for right angled and acute angled completion. Other
cells with three or more lobed receptive fields might account for
completion across "T" and "X" vertices. The requirement to have a
specialized cell for every vertex configuration however leads to a
combinatorial problem, as each specific cell type would have to exist
at every orientation at every spatial location in the cortex, and
appropriate cooperative and competitive interactions defined between
different feature cells. This line of reasoning was never elaborated
into a complete theory. A similar combinatorial problem is encountered
in Zucker's cocircularity detector cells [15], where "cooperative"
cells specialized for edges of every curvature must be replicated at
every orientation and every spatial location in the model. This model
would suffer further combinatorial problems when extended to vertices
composed of more (and less) than two edges. Wilson and Richards [14]
present psychophysical evidence that colinear completion gives way
abruptly to vertex completion at a particular curvature, which they
proposed was evidence for two different mechanisms of curve
detection. The same phenomenon was discussed by Kanizsa [10], who
illustrated the effect with illusory curves composed of lines of dots,
showing that the colinear grouping percept gives way to a sharp vertex
grouping at about the same curvature observed by Wilson &
Richards. Lehar [12] shows that this effect can be explained by a
transition from the second to the third harmonic in the Orientational
Harmonic model.

Apologies for the poor quality presentation of the simulation results-
here are some of those same results rendered more faithfully.


Return to argument
Return to Steve Lehar


